A steady market with growing confidence - REINZ stats January 2025
Wednesday, 19 February 2025


By continuing, you agree to our terms of use and privacy policy
Instructions on how to reset your password will be sent to the email below.
Your password reset link has been sent. Please check your inbox and follow the instructions provided.
Wednesday, 19 February 2025
The latest figures from the Real Estate Institute of New Zealand (REINZ) for January 2025 showed some positive signs across the New Zealand property market, tempered with the usual slowness of the holiday period.
"While the numbers predictably show January being a slower month due to the holidays, sales and listings were higher compared to January 2024, and open home volumes were strong across the country with a positive sentiment shown from buyers. ” explains Chief Executive Jen Baird.
As expected during the summer holiday period, sales were up 17.5% (from 3,212 to 3,774) compared to January 2024, and were down month-on-month by 37.6% (from 6,048 to 3,774) across New Zealand compared to December 2024. For New Zealand, excluding Auckland, sales saw a 23.4% year-on-year rise, from 2,318 to 2,861. Notable growth in sales was observed in Marlborough (+62.5%) and West Coast (+47.4%) year-on-year while all regions saw a decrease in sales month-on-month.
“When we adjust the sales figures for seasonality, we see that the year-on-year difference is higher than expected, reflecting a shift in buyer sentiment over the past year, from caution to more confidence,” Baird says.
The median price for New Zealand decreased slightly, down 1.7% from $763,000 to $750,000 year-on-year. Excluding Auckland, the median price increased 0.9% year-on-year, rising from $685,000 to $691,500.
Only eight out of sixteen regions reported an increase in median prices compared to January 2024. Gisborne had the highest increases up 28.2% from $515,000 to $660,000, followed by Nelson with a 25.4% increase from $670,000 to $840,000 – a record for this region.
“January is traditionally a slower month as New Zealand enjoys its holidays. Year-on-year January shows prices holding steady. Buyers are still enjoying the choices on offer thanks to rising listing numbers and significant levels of property for sale. Firsthome buyers and owner-occupiers are still the largest groups at open homes, with salespeople reporting investor interest in pockets of the country. Holiday spots like Taupo and Nelson also seeing interest from visitors from other parts of the country,” added Baird.
Overall, listings nationally increased year-on-year by 21.2% from 7,347 to 8,904, the highest level of listings for January since 2015. Excluding Auckland, listings rose by 21.9% compared to January 2024, from 4,886 to 5,956. Northland was the only region that didn’t report an increase in listings compared to last year; the most significant gains were reported in the West Coast (+100%), Otago (+52.4%), and Gisborne (+45.7%).
National inventory levels increased by 18.9% year-on-year and also increased by 10.0% compared to December.
“All regions are seeing an increase in stock numbers with Gisborne, Marlborough and Otago leading the way,” adds Baird.
“With vendors being realistic in their price expectations and meeting the market, there is a positive sentiment out there amongst agents. Steady and improving is the feedback, with the next few months looking busier with a strong pipeline of property coming to market.”
In January, there were 263 auctions nationally (7.0% of all sales), an increase from the previous year but a sharp decrease from December, as usually happens due to the January holidays. The national median days to sell rose by 3 days, to 54 days, compared to the previous year; excluding Auckland, it increased by five, to 54 days.
The House Price Index (HPI) for New Zealand is currently at 3,606, indicating a decrease of 1.4% year-on-year and 0.2% compared to December 2024. Over the past five years, the average annual growth rate of New Zealand’s HPI has been approximately 4.3%. However, it is currently 15.7% lower than its peak in 2021.
Regional highlights:
- Marlborough had the largest sales count percentage increase year-on-year, up by 62.5% year-on-year from 40 to 65.
- Fourteen out of fifteen regions reported increases in listings compared to last year. The regions with the most significant increases were West Coast (+100%), Otago (+52.4%), and Gisborne (+45.7%).
- Eight of the sixteen regions had a median price increase year-on-year. The West Coast led the way with an increase of 28.2% year-on-year with a median price of $660,000. Nelson increased by 25.4% year-on-year, hitting a record high with the median sale price reaching $840,000.
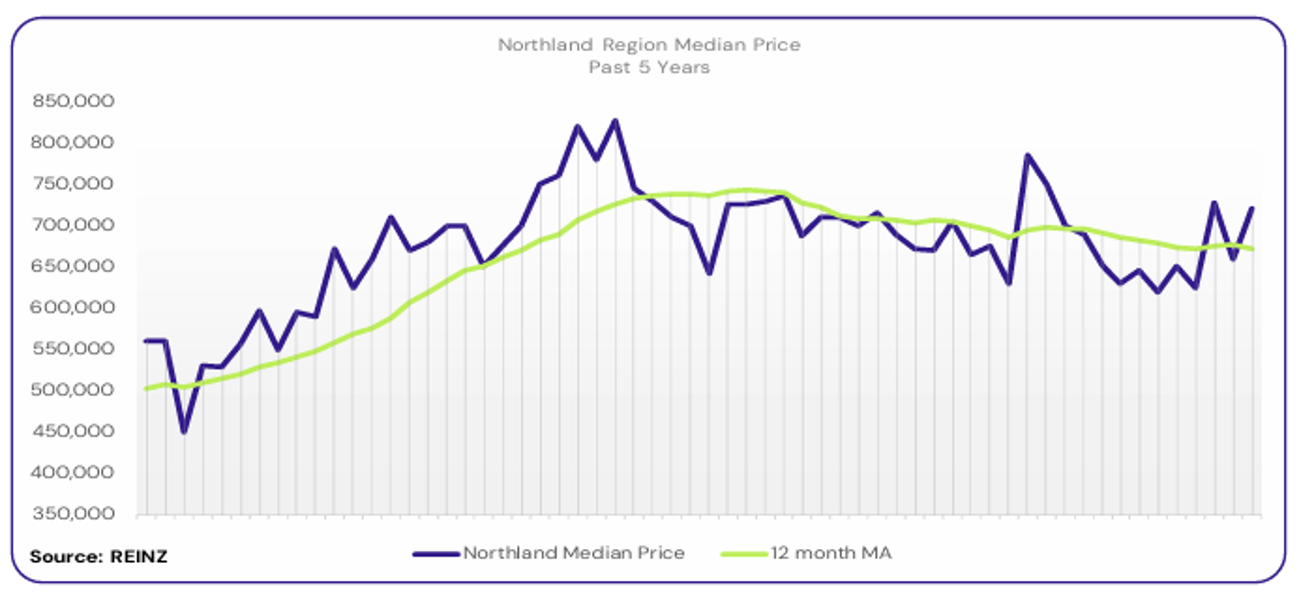
The median price for Northland decreased by 8.3% year-on-year to $720,000
“Owner-occupiers and first-home buyers were the most active buyer groups in Northland in January. Most vendors are aware of market conditions and set realistic price expectations, some adjusted their expectations to meet the market, and some held firm on their original expectations.
Open home attendance varied, with properties that are well priced or new to the market drawing more interest. There were good levels attendance at some auctions, but other auctions saw the majority passed in. Market sentiment was more positive, with buyers showing more confidence thanks to lower interest rates, more listings to choose from, and pricing remaining steady. These factors are contributing to a lack of urgency among buyers, although enquiry levels are good. Local agents predict that activity may slowly start to improve over the next few months.” (REINZ).
The current median Days to Sell of 58 days is more than the 10-year average for January which is 54 days. There were 37 weeks of inventory in January 2025 which is 5 weeks less than the same time last year.
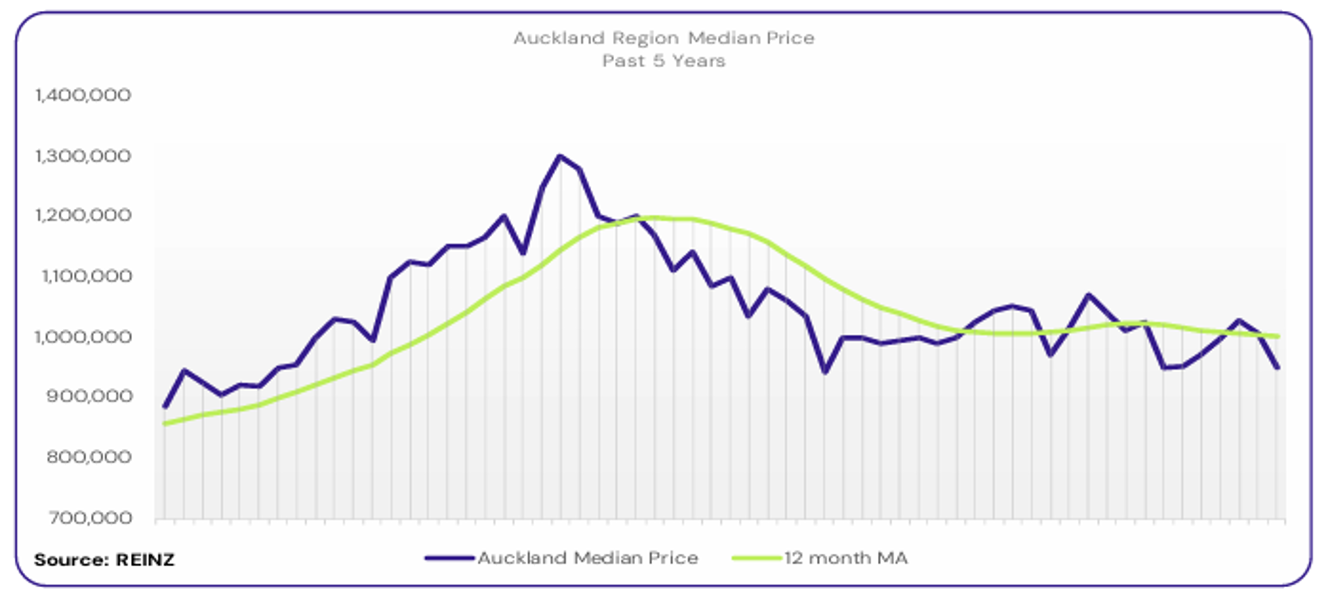
The median price for Auckland decreased by 2.2% year-on-year to $949,000
“First-home buyers and owner-occupiers were the most active buyer groups, with developers focused on South Auckland. Most vendors held firm on their preferred price, but others adjusted their expectations to meet the market. Open home attendance was quiet during the holidays, but picked up later in the month. Auction activity varied; about a third of sales in South Auckland were sold through this method.
Local agents report signs of a steady market, with a sense of uncertainty balanced by a growing expectation that activity will slowly improve over the next few months.” (REINZ).
The current median Days to Sell of 56 days is much more than the 10-year average for January which is 45 days. There were 30 weeks of inventory in January 2025 which is 4 weeks more than the same time last year.
Waikato’s median price decreased by 3.4% year-on-year to $749,000
“First-home buyers, owner-occupiers, and holiday home buyers were all active in the region, with Taupo seeing some investor activity as well. Vendor expectations varied, with some setting prices in anticipation of market growth, and others keeping their expectations realistic to meet the current market. There were stronger viewing numbers at open homes in many areas, compared with usual January levels, with some holidaymakers from elsewhere viewing properties. Auctions were quiet but attendance improved later in the month.
Interest rates, lending restrictions, the cost of living, and high levels of listings are influencing market sentiment, with local agents reporting that some buyers are cautiously watching interest rate movements and lending criteria closely before committing. Local agents report that confidence is improving, and they predict that the market will remain steady, with buyer demand increasing over the next few months." (REINZ).
The current median Days to Sell of 59 days is much more than the 10-year average for January which is 47 days. There were 24 weeks of inventory in January 2025 which is the same as the same time last year.
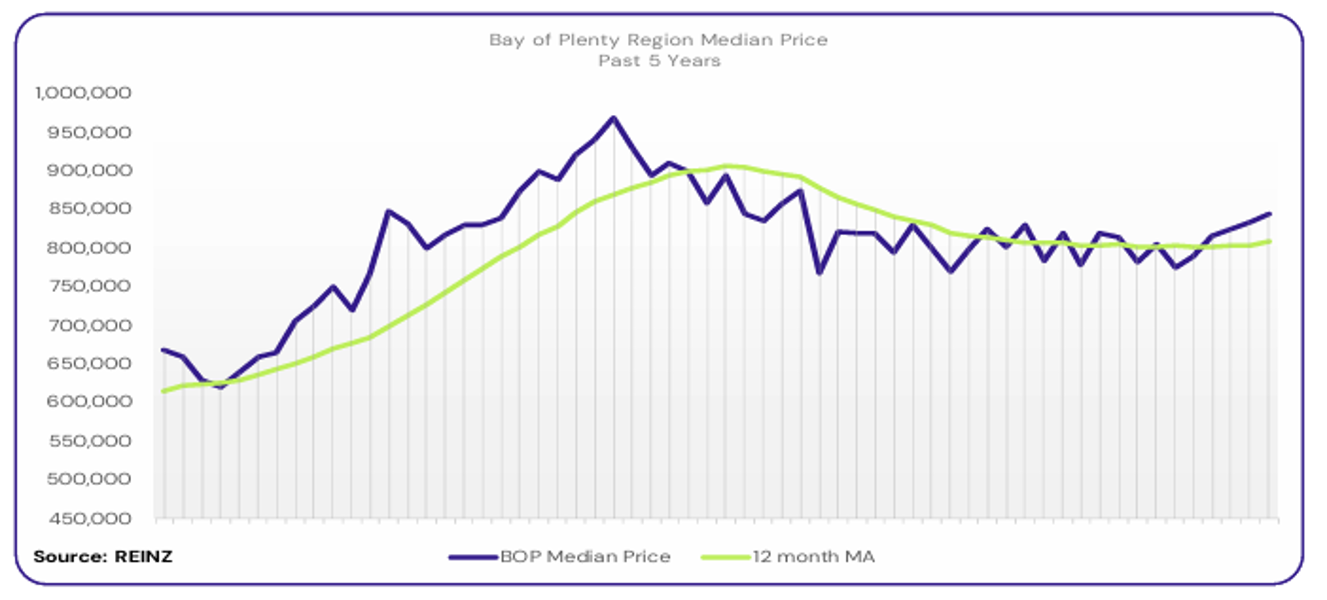
The median price for the Bay of Plenty increased by 7.6% year-on-year to $845,000
“First-home buyers and owner-occupiers were the most active buyer groups in the Bay of Plenty, with investors also returning to Rotorua. Most vendors are setting realistic price expectations to meet the market. Open home attendance levels were strong, including for some properties that have been on the market for a longer timeframe. Auctions began once the holidays ended, with good levels of sales, solid bidding numbers, and some auctions brought forward and sold prior.
Interest rates continue to shape market sentiment, and local agents report a steady and busy market, with a lot of appraisals being done. They predict activity will steadily improve over the next few months.” (REINZ).
The current median Days to Sell of 56 days is more than the 10-year average for January which is 50 days. There were 22 weeks of inventory in January 2025 which is the same as the same time last year.
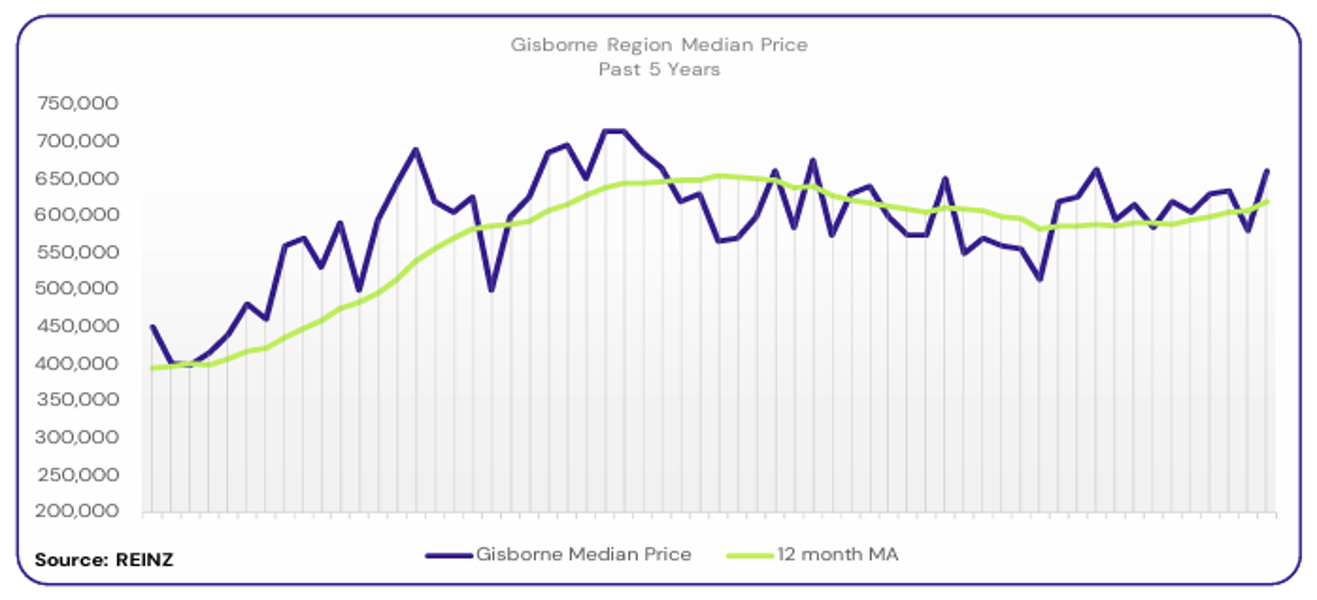
Gisborne’s median price increased 28.2% year-on-year to $660,000
“First-home buyers and investors were the most active in Gisborne. Increased numbers of sales are giving vendors a good indication of what buyers are willing to pay, and most vendors have realistic expectations to meet the market. Open home attendance levels increased significantly, with new listings attracting double the average number of attendees.
Lower interest rates were positively impacting market sentiment, but lending restrictions are a challenge for some buyers, and vendors’ main concern when selling is being able to purchase again. Local salespeople predict that activity will pick up in the next few months, with increased sales volumes and days-to-sell trending down.” (REINZ).
The current median Days to Sell of 57 days is much more than the 10-year average for January which is 43 days. There are 19 weeks of inventory in January 2025 which is 9 weeks more than last year.
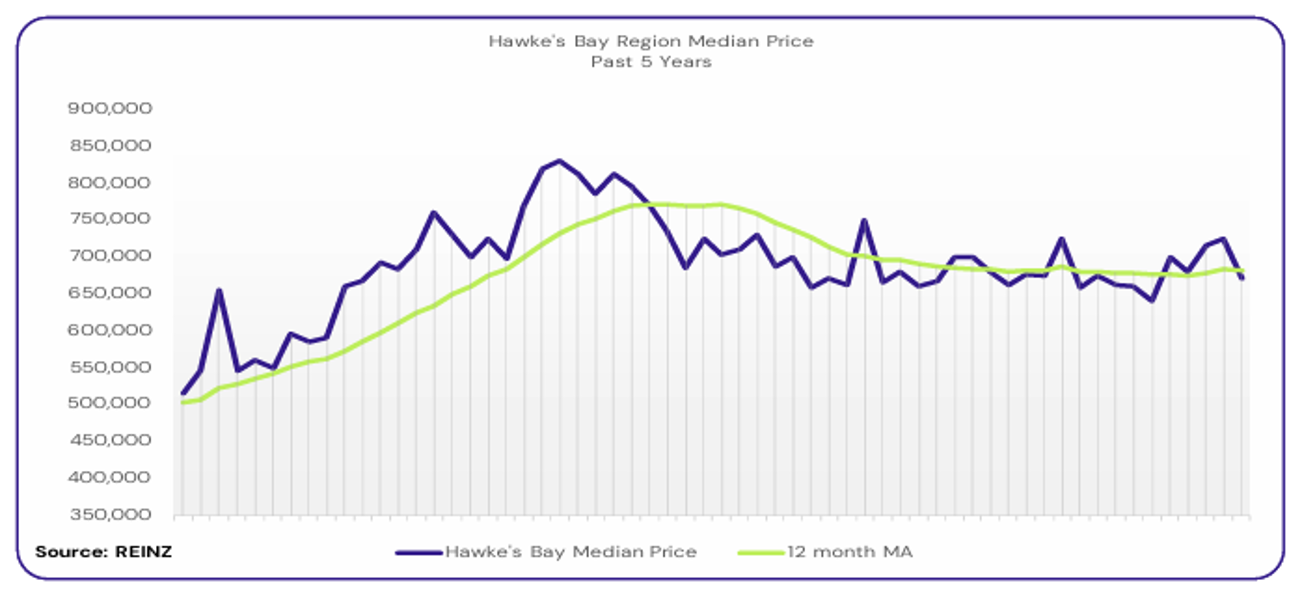
Hawke’s Bay’s median price eased slightly by 1.0% year-on-year to $670,000
“First-home buyers and investors were the most active buyer groups in Hawke’s Bay in January.Vendor expectations varied, with some willing to make adjustments to meet the market, and others holding firm on their original expectations. Open home attendance was higher than the previous month, with some areas seeing very high attendee numbers. Auction activity was also higher than the previous month.
Local agents report that market sentiment is more positive, particularly with lower- and mid-range priced properties, and predict that activity will lift over the next few months.” (REINZ).
The current median Days to Sell of 57 days is much more than the 10-year average for January which is 43 days. There were 17 weeks of inventory in January 2025 which is 1 week more than the same time last year
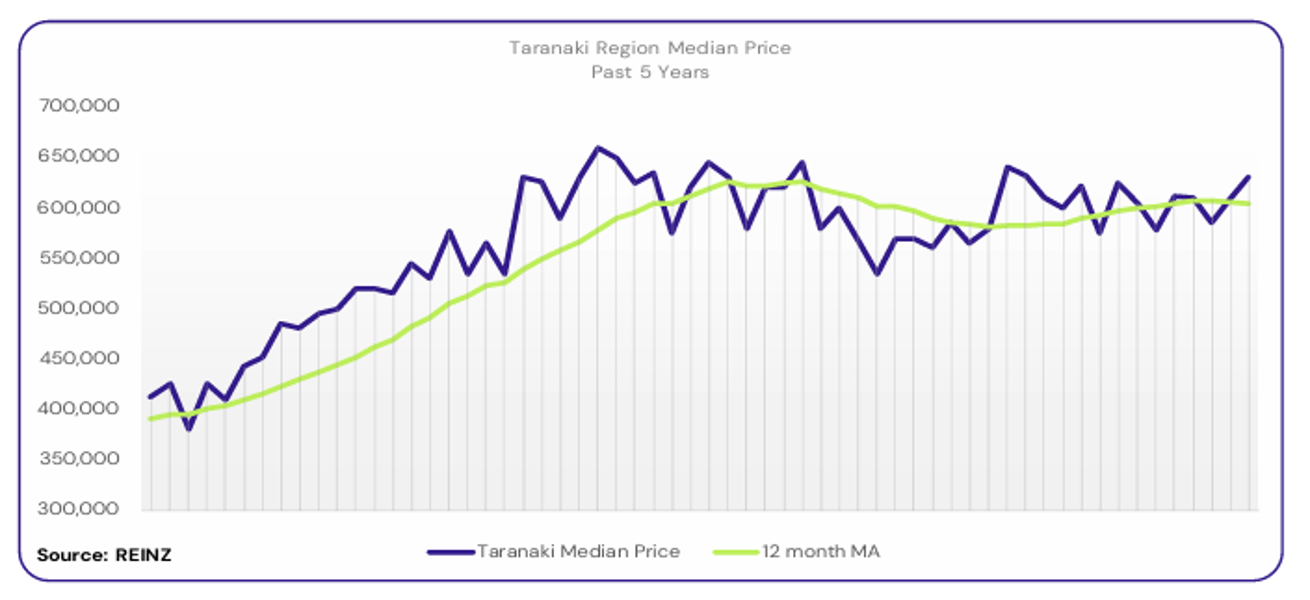
Taranaki’s median price decreased slightly by 0.3% year-on-year to $630,000
“All buyer types were active in Taranaki, including those from outside the region. Vendor expectations regarding sales price increased but stayed at relatively realistic levels. Open home attendance resumed in mid-January and was strong, especially for properties priced under $700K.
Market sentiment remained steady. It’s still a buyers’ market, but multi-offers are on the rise, so buyers are starting to feel a growing sense of competition. Local agents are confident that the Taranaki market will continue to strengthen each month until the traditionally quieter winter period. The OCR announcement in February may lead to more buyers entering the market.” (REINZ).
The current median Days to Sell of 49 days is more than the 10-year average for January which is 43 days. There were 20 weeks of inventory in January 2025 which is 2 weeks less than the same time last year.
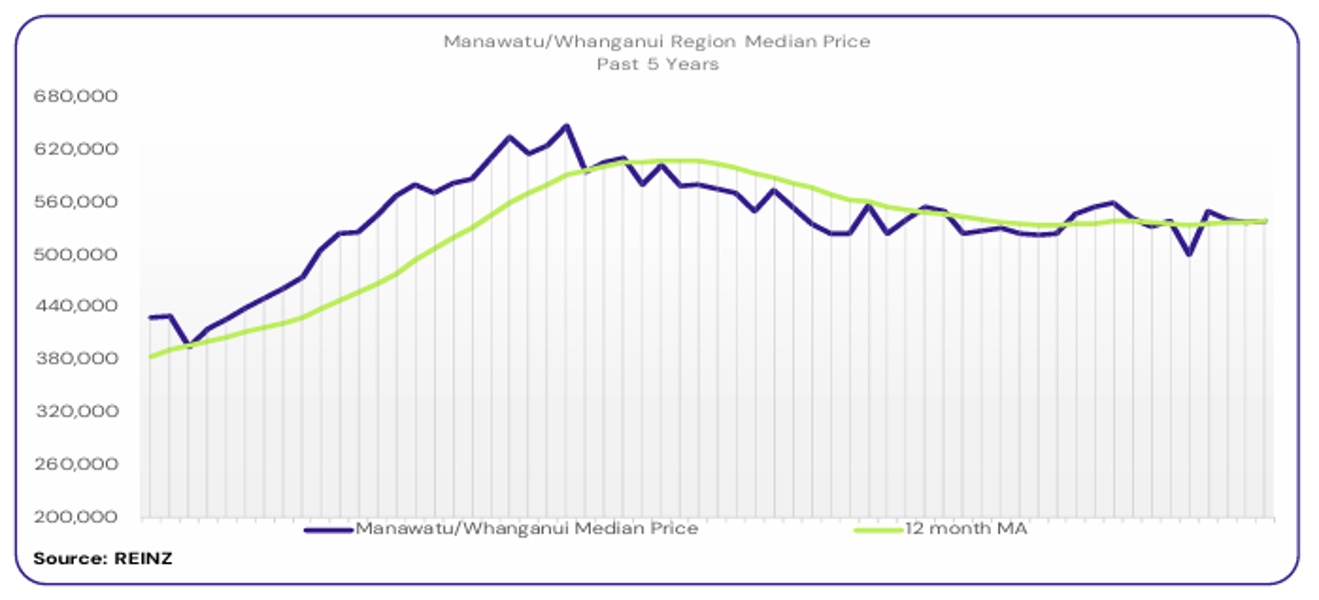
The median price for Manawatu/Whanganui increased by 3.1% year-on-year to $539,000.
“Owner-occupiers and first home buyers were the most active buyers in the region, while investor activity was very quiet. Vendor expectations varied, with some vendors having to adjust in light of residential house prices having decreased over the last few years. Attendance at open homes was good for newer listings, but properties that have been on the market for a long time got very few viewings.
Buyers seemed cautious about attending auctions, or viewing properties being sold via auction, as most buyers require finance and would like to know what price the listing is in before deciding. Interest rates, economic climate, job stability, and the cost of the living influenced market sentiment. Local agents predict that the market will continue to be steady over the next few months.” (REINZ).
The current median Days to Sell of 49 days is more than the 10-year average for January which is 42 days. There were 21 weeks of inventory in January 2025 which is 1 week more than the same time last year.
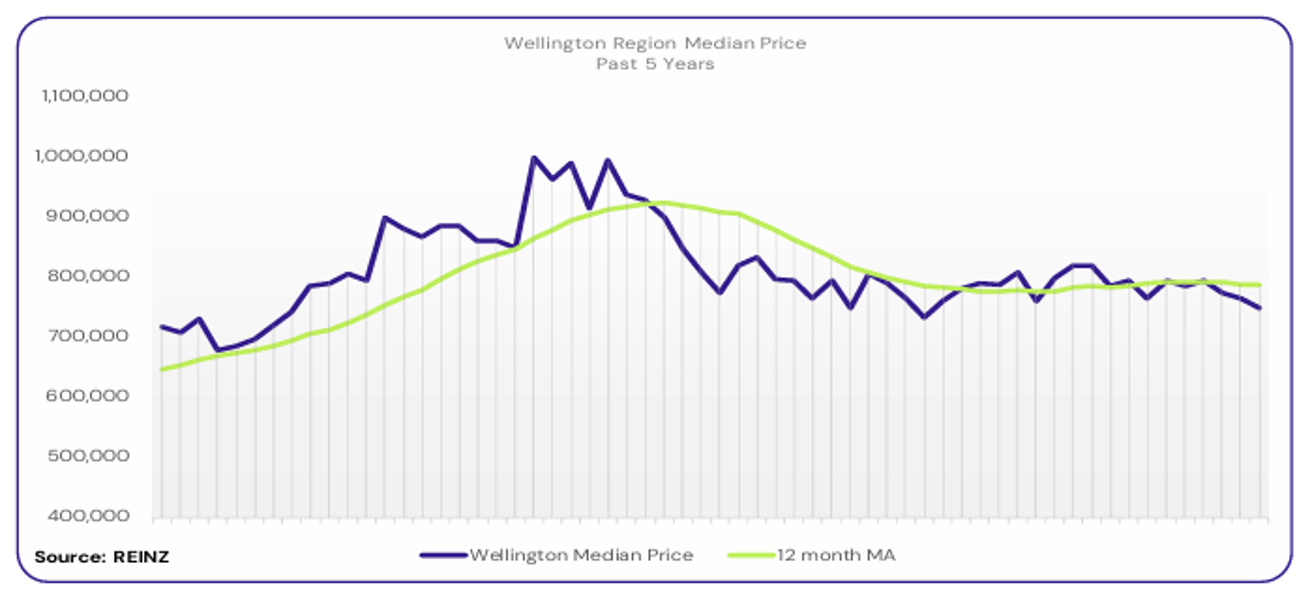
Wellington’s median price decreased by 1.3% year-on-year to $750,000
“First home buyers were the most active in the market in January. Some vendor expectations were higher as they were anticipating improvements in the market; local agents report that a lot of investors are selling properties. Attendance at open homes was steady for the month, an improvement from the end of 2024. Auction activity was quiet.
Interest rates continue to influence market sentiment and local agents report increased enquiry levels. Local salespeople predict the market will track upwards over the next few months.” (REINZ).
The current median Days to Sell of 59 days is much more than the 10-year average for January of 46 days. There were 16 weeks of inventory in January 2025 which is 4 weeks more than the same time last year.
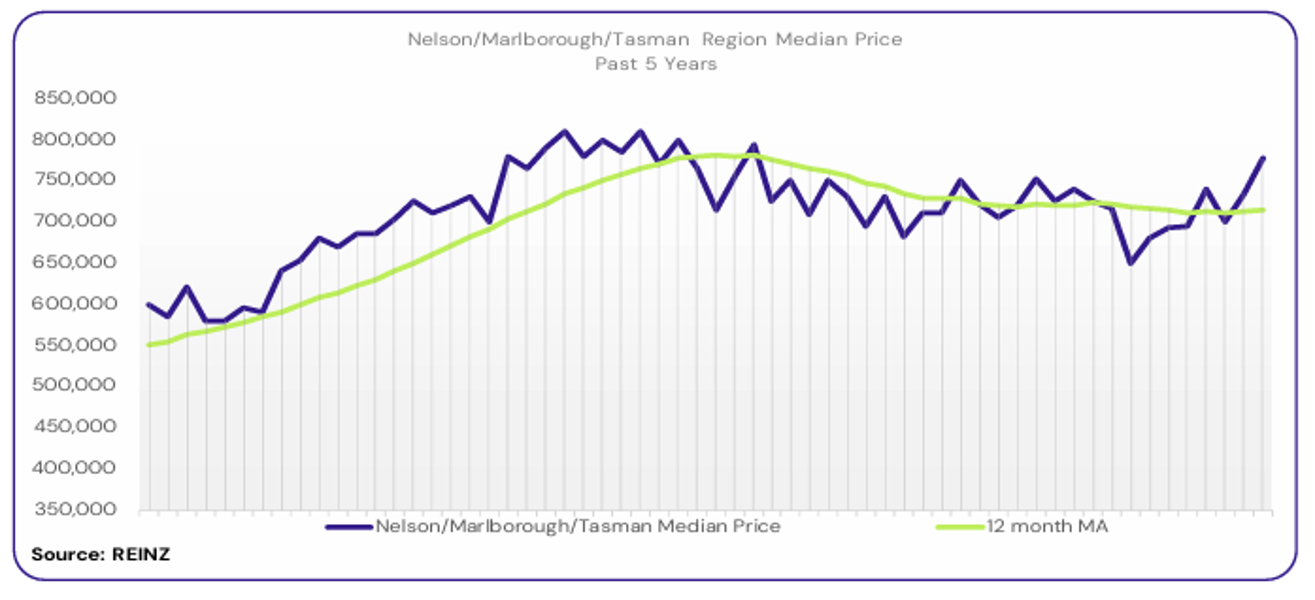
The median price for Nelson increased 25.4% year-on-year to $840,000 – a record for this region. The median price for Marlborough increased 0.3% year-on-year to $668,000. The median price for Tasman decreased by 9.8% year-on-year to $785,000.
“First home buyers and investors were the most active group, with overseas buyers becoming slightly more active as well in Nelson. Most vendor price expectations are realistic. More properties are having multiple offers made, which sometimes leads to vendors adjusting their expectations. Open home attendance varied, with properties that are newly listed or in the lower- to mid-price range seeing good numbers. Auction activity varied, with some areas seeing some interest and good results.
Interest rates, legislation, and lending criteria are influencing market sentiment and local agents report a sense of optimism and positivity. Local agents predict that market activity will lift as confidence grows, and, with plenty of visitors during summer, the number of buyers from outside the region may increase.” (REINZ).
The current median Days to Sell of 51 days is more than the 10-year average for January which is 43 days. There were 28 weeks of inventory in January 2025 which is 4 weeks more than the same time last year.
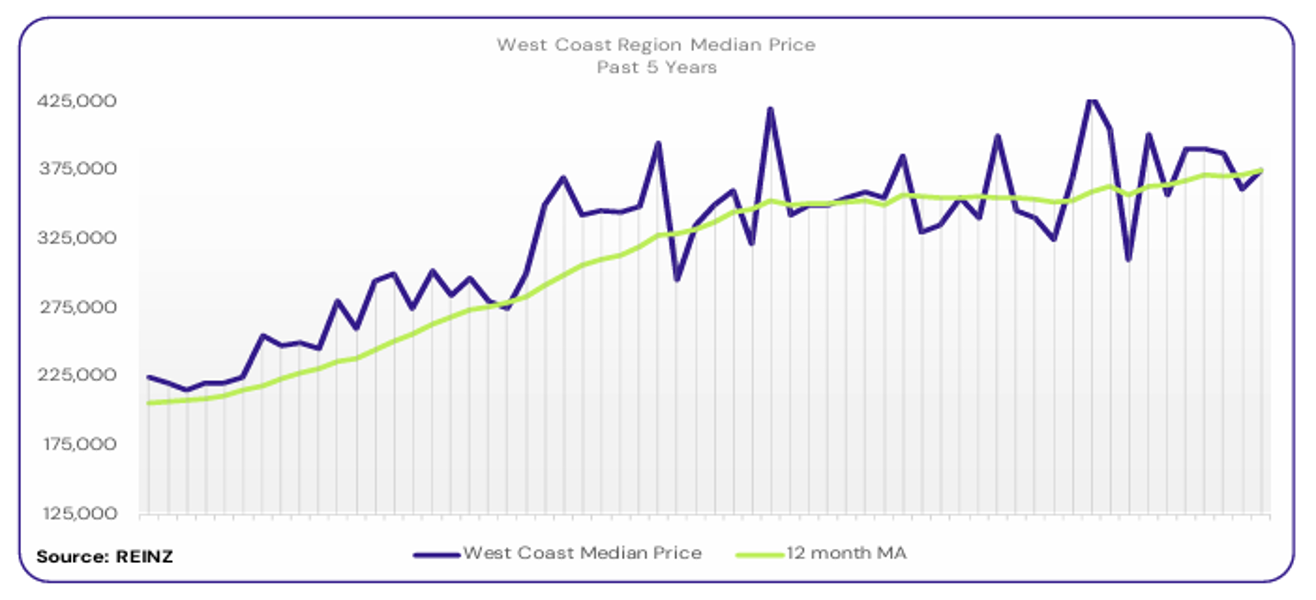
West Coast’s median price increased by 10.3% year-on-year to $375,000
“First-home buyers were the most active in West Coast’s market, while activity among most other buyer groups slowed over January. Vendor price expectations were higher, reflecting confidence about the market as a result of interest rates declining. Attendance at open homes was steady.
Local agents report fewer buyers in the market, so properties are remaining unsold for longer. Local salespeople predict that the market will pick up over the next few months as buyers return to take advantage of lower interest rates and more listings to choose from.” (REINZ).
The current median Days to Sell of 62 days is more than the 10-year average for January which is 57 days. There were 53 weeks of inventory in January 2025 which is 17 weeks more than the same time last year.
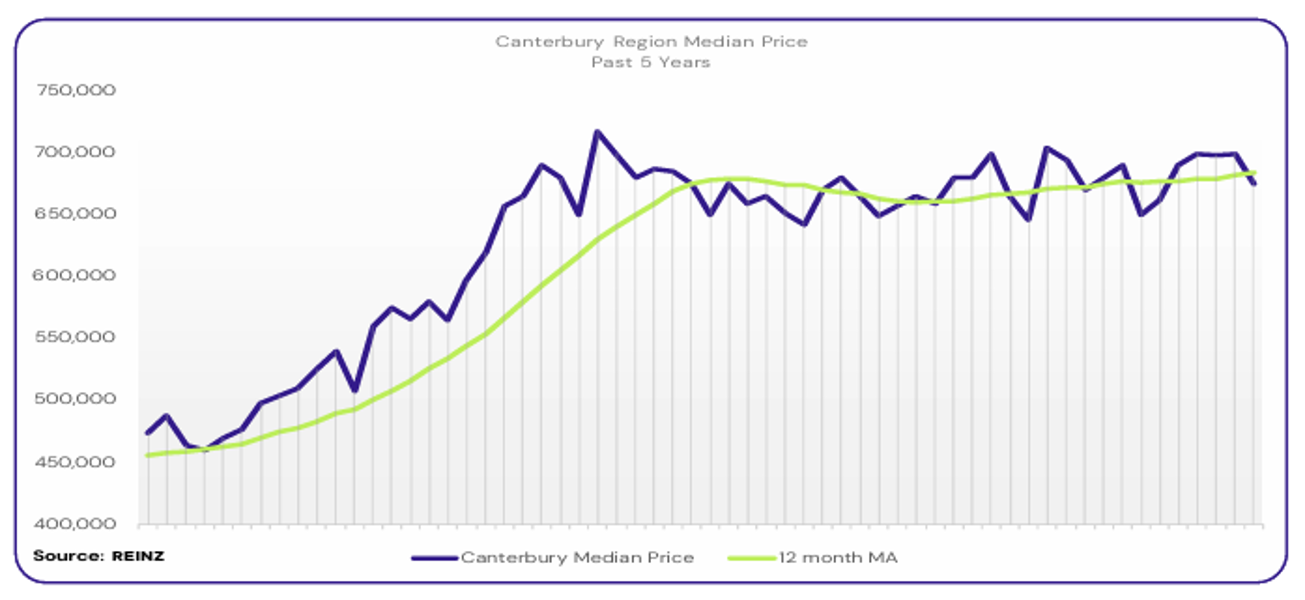
The median price for Canterbury increased by 4.5% year-on-year to $675,000
“Owner-occupiers and first-home buyers were the most active groups, with investors also active in Christchurch’s tertiary area due to an increase in university students. Some vendors are holding firm on their price expectations and are optimistic about the market improving, while others are willing to adjust to meet the market. Open home attendance and auction activity varied, with some areas seeing good numbers of attendees.
Interest rates, high numbers of listings, and steady prices are influencing market sentiment, which is positive. Local agents predict that activity will increase over the next few months.” (REINZ).
The current median Days to Sell of 51 days is more than the 10-year average for January which is 44 days. There were 18 weeks of inventory in January 2025 which is 3 weeks more than the same time last year.
Dunedin’s median price increased by 5.7% year-on-year to $608,000
Almost all buyer groups were active during January, apart from investors who were still cautious about market conditions. Most vendors were aware of current economic conditions and realistic in terms of pricing their property to meet the market. Attendance at open homes was very high, with auctions also being well attended.
The cost of living and interest rates continue to impact market sentiment. Local salespeople report that potential buyers are keen to make a decision, but economic factors can be challenging. Salespeople predict the market will remain the same over the coming months, with similar sales volumes and stable prices.” (REINZ).
Queenstown Lakes
“No particular buyer groups were active this month as January was typically quiet. Motivated vendors are willing to meet the market, but some vendors anticipate improvements in market conditions leading to property prices increasing. Open homes were attended by motivated buyers, but local agents suggest attendance will increase in the coming months.
Interest rates and the anticipation of potential OCR changes impacted market sentiment. Local agents report that demand is holding steady, and they predict confidence will improve over the next few months.” (REINZ).
The current median Days to Sell of 49 days is more than the 10-year average for January which is 45 days. There were 19 weeks of inventory in January 2025 which is 5 weeks more than the same time last year.
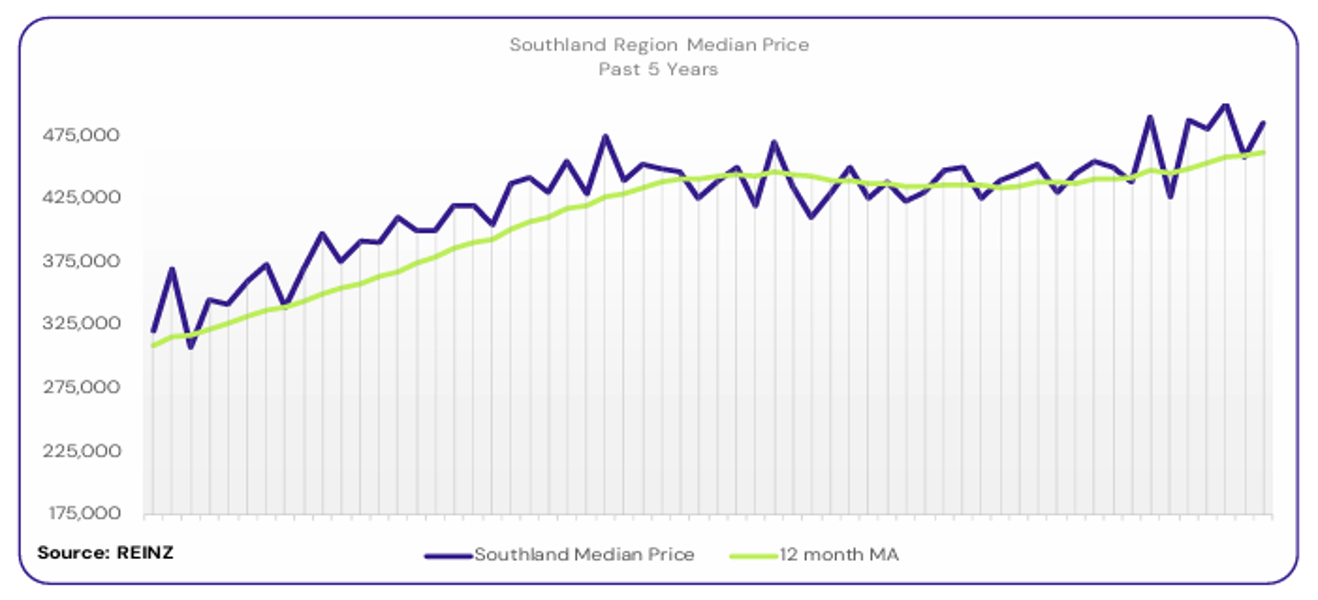
The median price for Southland increased by 7.2% year-on-year to $485,000
“First-home buyers and investors were the most active buyer groups in the region. Most vendors had realistic price expectations to meet the market. Open home attendance varied, with good numbers visiting new listings. Auctions activity was good, with bidding at most auctions.
Interest rates and low levels of unemployment are influencing market sentiment, which is positive, and local agents report good levels of demand. Local agents predict that the market will continue to see good levels of growth over the next few months, driven by lower interest rates, demand, and legislative changes that will support investors.” (REINZ).
The current median Days to Sell of 49 days is more than the 10-year average for January which is 41 days. There were 19 weeks of inventory in January 2025 which is 2 weeks more than the same time last year.
From the top of the North through to the deep South, our salespeople are renowned for providing exceptional service because our clients deserve nothing less.
Managing thousands of rental properties throughout provincial New Zealand, our award-winning team saves you time and money, so you can make the most of yours.
With a team of over 850 strong in more than 88 locations throughout provincial New Zealand, a friendly Property Brokers branch is likely to never be too far from where you are.

